Access the Live Dashboard
Experience the full functionality of our Administrative Workload Analytics Dashboard deployed on Vercel, featuring real-time data visualization and AI-powered insights.
Login Credentials
Username:
hwright@example.org
Password:
Silverleaf@123
Dashboard Features
Real-time KPIs, interactive visualizations, and AI insights
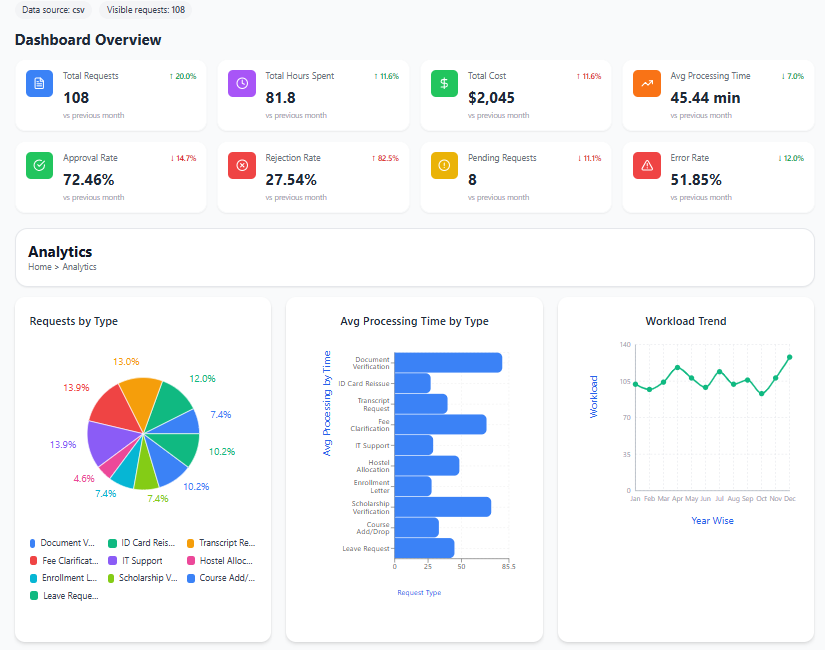
Key KPIs
- Avg Processing Time
- Requests Per Department
- Error / Rework Rate
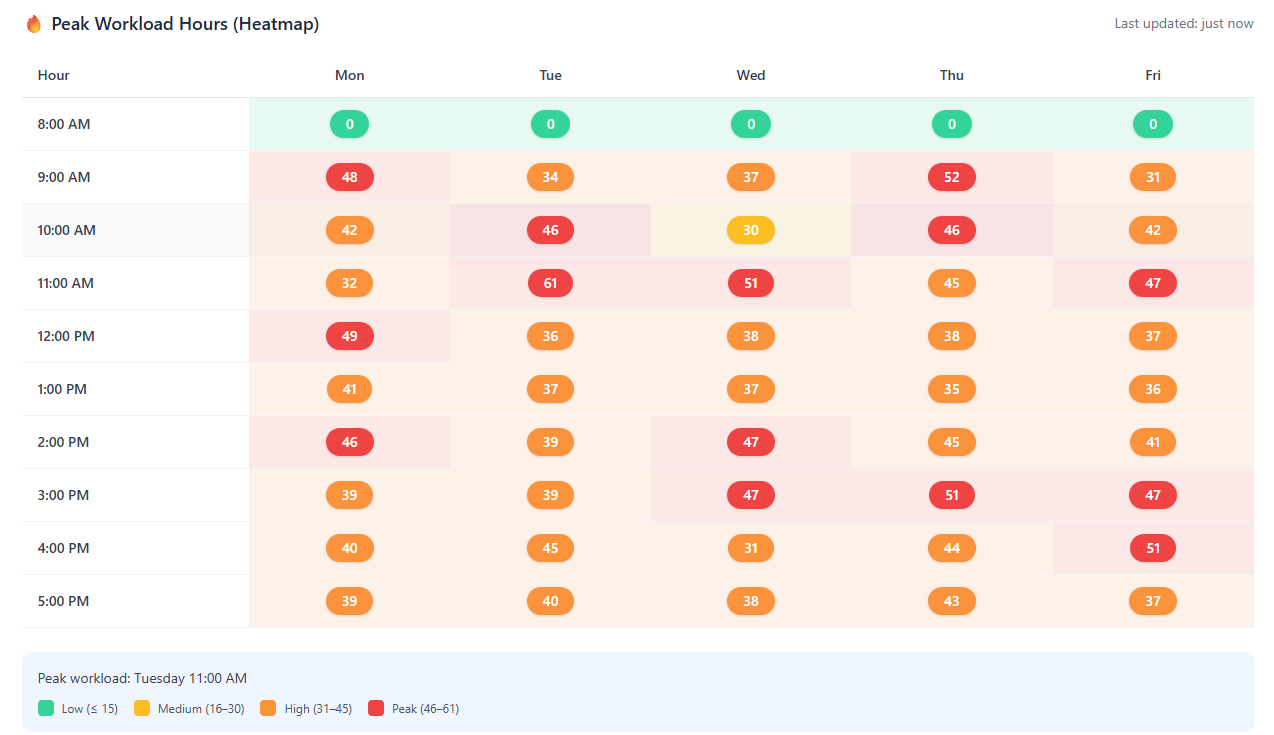
- Peak Hour Load
- Backlog Counts
- Automation Opportunity Score
- Staff Utilization
- Cost Savings Estimate
Visualization Types
Pie, bar, line, and heatmap views, interactive and filterable by department, date, and request type.
Insights
- Peak demand: 9–11 AM Monday–Thursday
- Document verification bottleneck: 76 min average
- International Office backlog: 40–50 requests
- Error rate: ~50% require rework
Recommendations
- Automate document verification (30–40% cycle reduction)
- Target International Office backlog (50% reduction goal)
- Staff schedules to match 9–11 AM demand
- Quality checks and training to reduce errors
Dashboard Features & Screenshots
📊 Main Analytics View
🔥 Peak Hour Heatmap
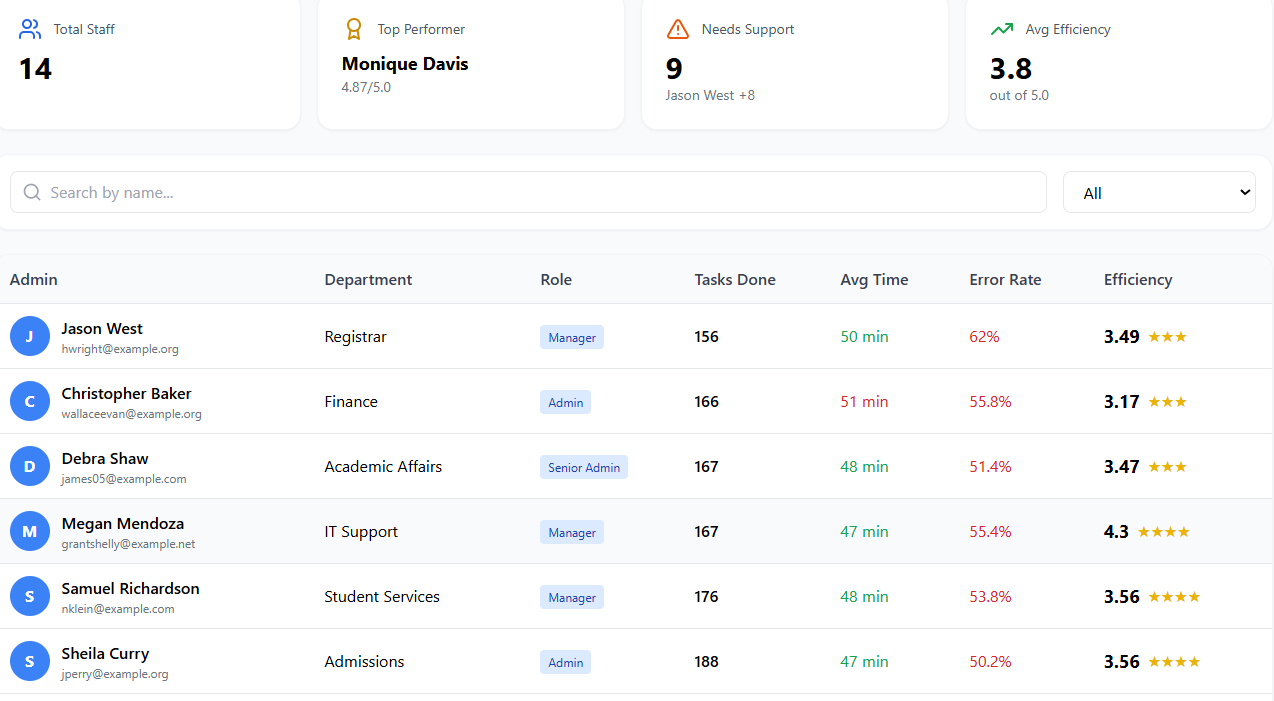
👥 Team Performance